Sunday, May 25, 2014

Is a College Degree worth all the trouble of a loan?

The problem with this question is one of definitions and how we measure the value of things. A college degree is inherently something good in nature as such it should hold some significant value to both the individual holding the degree and the society at large. In theory, the knowledge gained from a college degree should allow the individual to obtain work associated with said knowledge, but in our capitalistic market system this is not guaranteed. Further, it is a mere social convention of recent times that those with college education should be paid more than those with say a high school education. There are no laws compelling businesses to pay according to this norm, except the minimum wage which is currently set at $7.25 an hour as the federal minimum (some states can have higher). To help illustrate this point I have included two graphs from the 1940 on educational attainment vs. wages paid.

As the Chart 1 shows when the 1940 census data is charted as the percentage of the total population per income bracket by educational attainment it becomes very clear that having a college degree should earn you more money. Those with such degrees clearly occupy a much greater percentage of the highest income bracket at that time, and thus supporting the current thesis that college education gets you more income.

Chart 1- Source: U.S. Census (1) & Bureau of Labor Statistics for dollar conversion (2).

But when you chart this same data (see Chart 2) so as to see the distribution of income with in the society as whole by educational attainment you come up with a different picture. You quickly realize that majority of people in 1940 were making $8,500 to $17,000 2013 Dollars per year. In fact a careful examination of the data reveals that those with college education seem to be split into two groups. One group making the normal wage that most of the populace is making and then a group making a lot more.


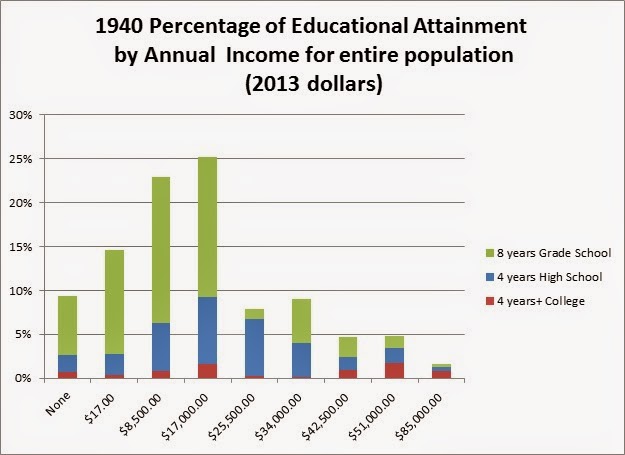
Chart 2- Source: U.S. Census (1) & Bureau of Labor Statistics for dollar conversion (2).

The problem is trying to do this kind of analysis with current data is not truly possible because the information is typically arranged in a statistical bell-curve pattern using median values. As such to tease out the data represented in Chart 2 is much more difficult, if not nearly impossible.

What can be done is comparing ranges and medians of the groups (see Chart 3). As such can see some overlay of income brackets, but since the median value represents the 50% mark it is hard to tell if there are truly more people in the higher end or lower end since it is nice smoothed bell-curve. What can be told is there does appear to be some overlap between the two educational degrees suggesting that it is possible that for someone with a bachelor degree to earn just as much as the median income of a high school degree. I suspect if the true population values were known per income groupings that we would no doubt see more of a curve similar to that of 1940.


Chart 3- Source: Bureau of Labor Statistics (2 & 3).

If anything what this information is more suggestive is that there are two major groups of people living and working in the U.S. currently. One group which is an overwhelming majority of the people earning pretty much the same wage regardless of educational attainment, and another group earning vastly much more and having higher education overall in comparison to the rest of the populace.

So does it mean is a college loan is worth all the trouble? I have to answer that I don’t think so, not really because of the possibility of not earning the median or higher wage amounts, but chiefly because of reasons mentioned in this and previous post concerning this type of loan. This is a loan that you can only get out of through death should something go wrong with the ability to pay. You cannot even try to “re-sell” the object you bought with the loan because it is just for you alone. That kind of loan is not worth any hope of better life, because you in the end become a slave to such a debt and such a life will be fraught with potential hardship.

It is far better to try one’s best to pay as you go, using any free money one can get (i.e. grants, grandparent’s paying for tuition, etc.). Sure this method may take you longer, but in the end you will have more freedom than one chained to debt.

Citations

(1) U.S. Census (1940). Table 2 - Wage or Salary Income in 1939, For Native White Males 25 To 64 Years Old Without Other Income, By Years of School Completed and Age, For The United States, Urban and Rural-Nonfarm: 1940. CPS Data on Educational Attainment: Educational Attainment. Data. Retrieved on 5-10-14 from http://www.census.gov/hhes/socdemo/education/data/cps/1946/p46-5/tables.html

(2) Bureau of Labor Statistics (2014). Consumer Price Index- All Urban Consumers. Series ID: CUSR0000SA0. Databases, Tables & Calculators by Subject. Data. Retrieved on 5-10-14 from http://www.bls.gov/data/  

(3) Bureau of Labor Statistics (2014). (unadj)- Usual weekly earnings (first decile), Employed full time, Wage and salary workers, High school graduates, no college, 25 years and over. Series ID: LEU0252917100. Databases, Tables & Calculators by Subject. Data. Retrieved on 5-10-14 from http://www.bls.gov/data/ 

(3) Bureau of Labor Statistics (2014). (unadj)- Usual weekly earnings (first quartile), Employed full time, Wage and salary workers, High school graduates, no college, 25 years and over. Series ID: LEU0252917200. Databases, Tables & Calculators by Subject. Data. Retrieved on 5-10-14 from http://www.bls.gov/data/ 

(3) Bureau of Labor Statistics (2014). (unadj)- Median usual weekly earnings (second quartile), Employed full time, Wage and salary workers, High school graduates, no college, 25 years and over. Series ID: LEU0252917300. Databases, Tables & Calculators by Subject. Data. Retrieved on 5-10-14 from http://www.bls.gov/data/ 

(3) Bureau of Labor Statistics (2014). (unadj)- Median usual weekly earnings (second quartile), Employed full time, Wage and salary workers, High school graduates, no college, 25 years and over. Series ID: LEU0252917300. Databases, Tables & Calculators by Subject. Data. Retrieved on 5-10-14 from http://www.bls.gov/data/ 

(3) Bureau of Labor Statistics (2014). (unadj)- Usual weekly earnings (third quartile), Employed full time, Wage and salary workers, High school graduates, no college, 25 years and over. Series ID: LEU0252917400. Databases, Tables & Calculators by Subject. Data. Retrieved on 5-10-14 from http://www.bls.gov/data/ 

(3) Bureau of Labor Statistics (2014). (unadj)- Usual weekly earnings (ninth decile), Employed full time, Wage and salary workers, High school graduates, no college, 25 years and over. Series ID: LEU0252917500. Databases, Tables & Calculators by Subject. Data. Retrieved on 5-10-14 from http://www.bls.gov/data/ 

(3) Bureau of Labor Statistics (2014). (unadj)- Usual weekly earnings (first decile), Employed full time, Wage and salary workers, Bachelor's degree only, 25 years and over. Series ID: LEU0252918900. Databases, Tables & Calculators by Subject. Data. Retrieved on 5-10-14 from http://www.bls.gov/data/ 

(3) Bureau of Labor Statistics (2014). (unadj)- Usual weekly earnings (first quartile), Employed full time, Wage and salary workers, Bachelor's degree only, 25 years and over Series ID: LEU0252919000. Databases, Tables & Calculators by Subject. Data. Retrieved on 5-10-14 from http://www.bls.gov/data/ 

(3) Bureau of Labor Statistics (2014). ((unadj)- Median usual weekly earnings (second quartile), Employed full time, Wage and salary workers, Bachelor's degree only, 25 years and over. Series ID: LEU0252919000. Databases, Tables & Calculators by Subject. Data. Retrieved on 5-10-14 from http://www.bls.gov/data/ 

(3) Bureau of Labor Statistics (2014). (unadj)- Usual weekly earnings (first quartile), Employed full time, Wage and salary workers, Bachelor's degree only, 25 years and over Series ID: LEU0252919100. Databases, Tables & Calculators by Subject. Data. Retrieved on 5-10-14 from http://www.bls.gov/data/ 

(3) Bureau of Labor Statistics (2014). (unadj)- Usual weekly earnings (third quartile), Employed full time, Wage and salary workers, Bachelor's degree only, 25 years and over. Series ID: LEU0252919200. Databases, Tables & Calculators by Subject. Data. Retrieved on 5-10-14 from http://www.bls.gov/data/ 

(3) Bureau of Labor Statistics (2014). (unadj)- Usual weekly earnings (ninth decile), Employed full time, Wage and salary workers, Bachelor's degree only, 25 years and over. Series ID: LEU0252919300. Databases, Tables & Calculators by Subject. Data. Retrieved on 5-10-14 from http://www.bls.gov/data/ 

Should we have no student loans in the U.S.?

While I agree that in principal people really shouldn’t use student loans for college, I do not think we can totally abandon this concept purely from a legal perspective of free enterprise. Nor do I think the Bank of Ed will any time soon be shuttered since it represents the best macro monetary control ever conceived of in long while.

With that said, many believe there is a lot of free money out there but the sad truth these days is that many financial aid packages are nothing more than loan schemes (1). There have been some Ivy League universities who have used zero-loan policies for low income students to eliminate the use of college loans (2). This is primarily accomplished through the maximization of grants, scholarships and similar free moneys (2).

While the results of such policies have truly encouraged the lower income, and hence higher minority, attendance and retention it is not without its draw backs (2 & 3). Evidently, with zero-loan policy produces potential workers who are willing to accept lower paying public careers or jobs vs. those with loans who are forced due to expense to choose academic pathways which lead to higher paying fields of work (2). Although from an alumni donation perspective college loans will reduce the amount of gifting from those student loans recipients vs. the zero-loan students (3).

In 1992, Finland went off the student loan idea for college (4). Now I know Finland and the U.S. are totally different in many ways, but Finland’s experience is an interesting one. In Finland, evidently those entering college have to join a student union which would be akin to a professional organization in the U.S. and said membership includes health care (4). Ironically the switch to pure state support for college didn’t really change the average expenses students would incur (such as housing, food, and clothing) nor did it dramatically increase as the state expenditures (4). Further after going to this method student and parental financial support for higher education actually increased with an estimated 42% of students working during college career in 1995 (4). Students at that time in Finland were averaging 3 credits per month which is about a class month in U.S. terms (4). Current statistics on Finland indicate that 46.2% of people 25 to 34 hold a bachelor degree or higher as of 2010 in comparison to the U.S which has 32.8% or nations like Germany at 18.9% or Japan at 33% (5). As a percentage of GDP in 2010, Finland is paying about 6.3% to support its system currently, whereas the U.S. is at 5.3%, Germany was at 4.5% and Japan was at a mere 3.6% (5). Surprisingly in Finland in 2012 63.6% of their populace aged 25 to 34 did not hold a college degree, and even so their labor force participation rate for this age set for 2013 was 20% (6 & 7). This statistic is similar to the U.S. where the same age set had a 20.6% labor force participation rate for 2013 (8). In comparison the U.S. and Finland labor statistics appear to be similar to that of each with the exception of inactivity. The U.S. seems to have currently a slightly higher level of inactive working population overall (see Chart 1 and Chart 2).


% of 2013 Population by labor force status and age (Finland)
Age
Labor Force Participation
Employment rate, %
Unemployment rate, %
Inactive
25-34
20.0%
18.4%
1.6%
4.1%
35-44
20.3%
19.1%
1.2%
2.7%
45-54
23.2%
21.8%
1.4%
2.9%
55-64
16.8%
15.6%
1.2%
9.9%

Chart 1- Source: Statistics Finland (7)


% of 2013 Population by labor force status and age (U.S.)
Age
Labor Force Participation
Employment rate, %
Unemployment rate, %
Inactive
25-34
20.6%
19.1%
1.5%
4.8%
35-44
19.9%
18.8%
1.2%
4.3%
45-54
21.1%
19.9%
1.2%
5.4%
55-64
15.4%
14.5%
0.8%
8.5%

Chart 2- Source: Bureau of Labor Statistics (8)

In the U.S. the general claim to obtain a secondary education degree is for more money, better job security, and lower unemployment. While this may be true in some statistical sense for certain population groups, clearly Finland’s choice of having no loans has helped greater numbers achieve higher education overall, but labor wise it doesn’t seem to be translating into lower unemployment overall. It is clear that Finland has different work values than that of the U.S. since it has allowed culturally a greater diversity of work to flourish which includes work for those who for whatever reason have not pursued higher education. The real stark difference between the U.S. and Finland is the fact that those between 25 and 34 seem to be starting homes and are actually taking on housing debt more so in Finland than in the U.S. (9). In contrast nearly 60% of this populace was renting in the U.S. (10). Clearly the U.S. student loan method is having an impact on such things as 1st time housing starts, while in Finland those with less education are still able to find work to support a housing loan despite the burden.

The problem is with student loans is not necessarily the fact they exist but the fact that such a loan structure can be used for abuse economically. I do think overall it is better for education as a whole not to be fettered to loans because it can bring into question a whole host of problems and moral dilemmas. But America is not Finland, and as such we must allow the idea of educational loans to still exist but clearly one that must be seriously regulated so as to protect the inherent goodness of higher education. Such regulations should not be totally based on the free market ideologies or totally in control of the political machine of government, but something more or less in between.

It seems more important than eliminating student loans would be the job market itself being able to provide all peoples with the opportunity of work that supports the worker and their family needs regardless of educational attainment. While I fully believe that education is inherently good in nature, not all peoples will be gifted enough to maximize that potential for whatever reason. This puts a care burden on those who have obtained higher education to care for those of lower educational status socially and not to laud or rule over them with their higher status. It seems to me that these fundamental thoughts have been lost in the conversation of work in U.S. as we exit the Great Recession.

Citations
(1) Woodruff, M. (2014). When parents pay for college, student debt becomes a family affair. Yahoo Finance. Retrieved on 5/25/14 from http://finance.yahoo.com/news/student-debt-nearly-destroyed-this-family-s-finances-150749696.html?soc_src=copy


(2) Hillman, N. W. (2013). Economic Diversity in Elite Higher Education: Do No-Loan Programs Impact Pell Enrollments?. Journal Of Higher Education, 84(6), 806-831.

(3) Rothstein, J., & Rouse, C. (2011). Constrained after college: Student loans and early-career occupational choices. Journal Of Public Economics, 95(1/2), 149-163. doi:10.1016/j.jpubeco.2010.09.015

(4) Kivinen, O., & Hedman, J. (2000). From a Loan-Based to a Grant-Based Student Support System: the Finnish experience. European Journal Of Education, 35(1), 97.

(5) Snyder, Thomas D., Sally A. Dillow, and (ED) National Center for Education Statistics. "Digest Of Education Statistics, 2012. NCES 2014-015." National Center For Education Statistics (2014): ERIC. Web. 21 May 2014

(6) Statistics Finland (2013). Last year persons aged between 35 and 39 had the highest level of education. Data. Retrieved on 5/25/14 from http://www.stat.fi/til/vkour/2012/vkour_2012_2013-12-04_tie_001_en.html

(7) Statistics Finland (2014). Labour force survey. Data. Retrieved on 5/24/14 from http://www.stat.fi/til/tyti/index_en.html

(8) Bureau of Labor Statistics (2014). Employment status of the civilian noninstitutional population by age, sex, and race. Data. Labor Force Statistics from Current Population Survey. Retrieved on 5/25/2014 from http://www.bls.gov/cps/cpsaat03.htm

(9) Statistics Finland (2009). Young adults the most indebted. Data. Retrieved on 5/25/14 from http://www.stat.fi/til/vtutk/2009/vtutk_2009_2011-12-21_kat_004_en.html

(9) Statistics Finland (2011). Households’ assets. Data. Retrieved on 5/24/14 from http://www.stat.fi/til/vtutk/index_en.html

(10) Bureau of Labor Statistics (2012). Current combined expenditure, share, and standard error tables- Age of reference person . Data. Labor Force Statistics from Current Population Survey. Retrieved on 5/25/2014 from http://www.bls.gov/cex/


Wednesday, May 21, 2014

Will you make more money with a college degree?

This is hard to tell because with every story of financial success shown, one can show financial failure as well. What I can tell you is that 2013 & 1940 medians appear to be higher for those with a college degree vs. a high school degree. But that difference currently is only 1.7 times for 2013 and 1.5 times for 1940 (1, 2, 3). Clearly there has been some growth between the two points over time, but still not much suggesting the population spread may be similar to each other.

The problem becomes with how to measure bottom-line concerning such an “investment” (and I use this term very loosely) because there are lots of ways to look at this problem. Many governments and other organizations tend to look at the over-all costs of the education vs. the long term total income output associated with the degree, but I have trouble with such a view. Since the medians for a college degree is typically higher logically the outcome would be that the long term income output will be higher as well. But this view doesn’t take into account the fact that the median income represents the 50% point, as such 50% of the people are not making the median but less than the median. So does it really pay off then for those people? Maybe and maybe not.

I honestly think the better approach is to look at things from more of an accounting perspective on this one (4). A college degree clearly is a non-transferrable intangible personal asset which actually does have a useful life span. That life span is only as relevant as the knowledge the degree contained is relevant and as such over time that knowledge will become obsolete in nature (case in point at one point many thought the sun circled the earth, but this was proven otherwise over time with careful observations). In general the life span of college degree is about 10 years (5). After this point the information the degree contains will be considered obsolete in nature and will require updating.

This means the cost of the college education can be amortized over the first 10 years after graduation against the first 10 years of annual income earned less the other annual living expenses (or net income). Since we don’t know exactly what the person’s income will be once graduated since it is possible to obtain work that does not require a college degree or through whatever means a person could obtain a very high paying job let us then proceed to look at the financial outcomes for various income levels to see the effects.

I will be making the following assumptions for these calculations- 1. The observed current growth rate of the wages for Bachelor degrees appears to be at a -1% rate (3), 2. The current observed inflation rate is at 2% making for a net resultant of -3% (-1%-2%) for overall income growth (2), 3. The annual expenditures assumptions will be based on Bureau of Labor Statistics data for consumer spending by educational attainment adjust to 2013 values and I am going to assume that even if you have a college degree that your living style is more dictated by your income than by the fact you have a degree(6). 4. Annual loan payment will be based on 6% APR over a 10 year period with the initial loan amount is based on current trends noted by the New York Federal Reserve Bank estimation on student loan amounts (7). Note- Any variation in the size of the loan, APR, and period will change the results of these calculations.

Total Net Income (10 years summed, 2013 dollars)
Less
than
high
school
graduate
High
school
graduate
High
school
graduate
with
some
college
Associate's
degree
Bachelor's
degree
College Loan
($33,148.22)
$8,062.31
$13,349.11
$80,776.86
$187,608.72
w/o College Loan
$8,062.31
$48,640.95
$53,927.75
$121,355.50
$228,187.36

As one can tell by the table above it is clear that if one takes a college loan out that the potential total net income earned is significantly reduced than if you had not taken a college loan. In fact if you happen to take out a loan and end up working a job that is typically paid the amount of money associated with a person who has less than a high school degree (i.e. say a minimum wage job), you will be basically bankrupt (without the ability to bankrupt against the loan). 

When trying to determine if you will make more money with a college degree, the question really is about what kind of pay you will make once you get out. This fact tends to be very variable depending upon current market conditions associated with how many jobs are open for your degree when you graduate, the current unemployment rate for your degree, and the total number of possible college graduates in your degree (larger volumes of those with a similar degree can cause a supply demand issue with the labor if there is few jobs available for large numbers). When calculating such risks it helps to understand that in the first ten years of one’s post graduate state, that there is the possibility of having to work jobs which will not earn enough to pay for a loan. So knowing the loan specifics (like APR, and size of the loan) can dramatically affect the outcome of these possibilities. 

In general though, what these numbers are indicating is that when a taking out a student loan you must have already lined up a good outcome with regards to future work (i.e. you need to know where and how much you will be earning at the end of your studies), and if not then it is best not to take the loan.

Thus you will no doubt make more money with a college degree provided you land a job that has income associated with a college degree and you will make even more money without the student loan.

But with all things considered, one must remember and take into account that we have no laws that guarantee the current typical income associated with a college degree and as such through market actions it is possible that current social pay norm associated with a college degree can become over time the same as the minimum wage law requirements.

Citations 

(1) U.S. Census (1940). Table 2 - Wage or Salary Income in 1939, For Native White Males 25 To 64 Years Old Without Other Income, By Years of School Completed and Age, For The United States, Urban and Rural-Nonfarm: 1940. CPS Data on Educational Attainment: Educational Attainment. Data. Retrieved on 5-10-14 from http://www.census.gov/hhes/socdemo/education/data/cps/1946/p46-5/tables.html

(2) Bureau of Labor Statistics (2014). Consumer Price Index- All Urban Consumers. Series ID: CUSR0000SA0. Databases, Tables & Calculators by Subject. Data. Retrieved on 5-10-14 from http://www.bls.gov/data/

(3) Bureau of Labor Statistics (2014). (unadj)- Usual weekly earnings (first decile), Employed full time, Wage and salary workers, High school graduates, no college, 25 years and over. Series ID: LEU0252917100. Databases, Tables & Calculators by Subject. Data. Retrieved on 5-10-14 from http://www.bls.gov/data/  

(3) Bureau of Labor Statistics (2014). (unadj)- Usual weekly earnings (first quartile), Employed full time, Wage and salary workers, High school graduates, no college, 25 years and over. Series ID: LEU0252917200. Databases, Tables & Calculators by Subject. Data. Retrieved on 5-10-14 from http://www.bls.gov/data/  

(3) Bureau of Labor Statistics (2014). (unadj)- Median usual weekly earnings (second quartile), Employed full time, Wage and salary workers, High school graduates, no college, 25 years and over. Series ID: LEU0252917300. Databases, Tables & Calculators by Subject. Data. Retrieved on 5-10-14 from http://www.bls.gov/data/  

(3) Bureau of Labor Statistics (2014). (unadj)- Median usual weekly earnings (second quartile), Employed full time, Wage and salary workers, High school graduates, no college, 25 years and over. Series ID: LEU0252917300. Databases, Tables & Calculators by Subject. Data. Retrieved on 5-10-14 from http://www.bls.gov/data/

(3) Bureau of Labor Statistics (2014). (unadj)- Usual weekly earnings (third quartile), Employed full time, Wage and salary workers, High school graduates, no college, 25 years and over. Series ID: LEU0252917400. Databases, Tables & Calculators by Subject. Data. Retrieved on 5-10-14 from http://www.bls.gov/data/  

(3) Bureau of Labor Statistics (2014). (unadj)- Usual weekly earnings (ninth decile), Employed full time, Wage and salary workers, High school graduates, no college, 25 years and over. Series ID: LEU0252917500. Databases, Tables & Calculators by Subject. Data. Retrieved on 5-10-14 from http://www.bls.gov/data/

(3) Bureau of Labor Statistics (2014). (unadj)- Usual weekly earnings (first decile), Employed full time, Wage and salary workers, Bachelor's degree only, 25 years and over. Series ID: LEU0252918900. Databases, Tables & Calculators by Subject. Data. Retrieved on 5-10-14 from http://www.bls.gov/data/

(3) Bureau of Labor Statistics (2014). (unadj)- Usual weekly earnings (first quartile), Employed full time, Wage and salary workers, Bachelor's degree only, 25 years and over Series ID: LEU0252919000. Databases, Tables & Calculators by Subject. Data. Retrieved on 5-10-14 from http://www.bls.gov/data/  

(3) Bureau of Labor Statistics (2014). ((unadj)- Median usual weekly earnings (second quartile), Employed full time, Wage and salary workers, Bachelor's degree only, 25 years and over. Series ID: LEU0252919000. Databases, Tables & Calculators by Subject. Data. Retrieved on 5-10-14 from http://www.bls.gov/data/

(3) Bureau of Labor Statistics (2014). (unadj)- Usual weekly earnings (first quartile), Employed full time, Wage and salary workers, Bachelor's degree only, 25 years and over Series ID: LEU0252919100. Databases, Tables & Calculators by Subject. Data. Retrieved on 5-10-14 from http://www.bls.gov/data/  

(3) Bureau of Labor Statistics (2014). (unadj)- Usual weekly earnings (third quartile), Employed full time, Wage and salary workers, Bachelor's degree only, 25 years and over. Series ID: LEU0252919200. Databases, Tables & Calculators by Subject. Data. Retrieved on 5-10-14 from http://www.bls.gov/data/  

(3) Bureau of Labor Statistics (2014). (unadj)- Usual weekly earnings (ninth decile), Employed full time, Wage and salary workers, Bachelor's degree only, 25 years and over. Series ID: LEU0252919300. Databases, Tables & Calculators by Subject. Data. Retrieved on 5-10-14 from http://www.bls.gov/data/  

(4) FASB (2012). Intangibles—Goodwill and Other (Topic 350). Financial Accounting Series, Accounting Series Update, No. 2012-02, July 2012. Retrieved on 5-10-14 from http://www.fasb.org/cs/BlobServer?blobkey=id&blobwhere=1175824275038&blobheader=application/pdf&blobcol=urldata&blobtable=MungoBlobs .
(5) U.S. Department of Education (2013). Repayment Plans. Retrieved on 5-10-14 from http://www.direct.ed.gov/RepayCalc/dlindex2.html .

(5)Central New Mexico Community College (2012). Updating Certificate or Degree. Retrieved on 5-10-14 from http://www.cnm.edu/student-resources/academicrecords/indexed/updatingcertordegree.html .

(6) Bureau of Labor Statistics (2013). Table 2010- Highest education level of any member: Annual expenditure means, shares, standard errors, and coefficient of variation, Consumer Expenditure Survey, 2012. Consumer Expenditure Survey. Combined Expenditure, Share, and Standard Error Tables. Retrieved on 5-10-14 from http://www.bls.gov/cex/csxcombined.htm .

(7) Federal Reserve Bank of New York (2013). Student Debt by Age Group. Retrieved on 5/12/14 from http://www.newyorkfed.org/studentloandebt/.

Friday, May 16, 2014

Will College Debt pop like Housing in 2007?

By pop I assume you are talking about a sudden collapse in prices. Well as noted in my previous post, college debt is run by the Bank of Ed right now, and considering the ease at which one can obtain such a loan (usually the simple click of a mouse button) it is pretty clear that it’s a sub-prime market.

As such the Federal Government is engaging in a form of economic stimulation that will do nothing but cause inflation, at least where colleges are concerned. This could in part explain the reason why the prices of college keep going up the way they have in recent times. It is just pure inflation due to the free Federal dollars flowing into the system.

Unlike the housing market, the asset that results from a college loans is intangible in nature. In fact, I am uncertain you could truly assign a market value to a college degree like that of a house because by its nature it is non-transferrable to another person. As such there appears to be no way for the value of college degrees to recreate the conditions like housing where one could end up “under water” with the loan simply due to market trade conditions or to cause Wall Street to collapse unless these loans were repackaged into some sort of security instrument.

But according to Michael Wenisch writing in the Catholic Social Science Review, “With the exception of a handful of extremely wealthy universities, institutions of higher learning are for the most part substantially dependent on student tuitions, and thus also on student loans, in order to operate. Without the continuing growth of the student loan bubble, it is foreseeable that many colleges and universities will be forced to declare bankruptcy and cease operations over the next ten years.” (1)

And according to Andrew Ross writing in the New Labor Forum, the “transfer of fiscal responsibility from the state to the individual … has been steady for more than three decades, but the rate of transfer has quickened in recent years, driving up tuition costs in all sectors (they have risen by 500 percent since 1985), but in state universities in particular. Last year, overall state funding was cut by 7.6 percent, the largest decline in more than half a century.”(2)

So it is clear that without the student loans the higher education market could not maintain itself at its current pace, as such there are some who have looked at this market and believe that it could collapse simply by two things-

1. The sudden withdrawal of Federal funding of the loans.

2. The sudden withdrawal of students obtaining loans or attending college.

Either of these two conditions would cause the college market environment to experience a sudden contraction event, but unlike the housing boom this contraction event will not be so wide spread in economic effect. The flow of cash into the college market is simply too isolated from the rest of the economy to impact such things as Wall Street. As such a sudden collapse would only at best cause a smaller labor pool of college graduates doing nothing more than raising the wages for college level work which in effect would again attract more people back to college.

Personally I don’t think the 1st event is even possible because the Federal funding of college loans is a budget deficit offset (as in it is a negative budget element), so Congress really doesn’t have an incentive to stop the loaning while other spending continues. In fact, college loaning makes a great tool to balance the budget, or at least get closer to that goal. At least it is helping the States supporting colleges to make cut backs allowing them to balance their budgets based on Ross’ observations (2).

What is more likely to occur than either of the two conditions above is greater amounts of default on college loans which does nothing but raise the budget deficit. This point was noted in the Economy online section of BloombergBusinessweek by Caroline Salas Gage and Janet Lorin article entitled Student Loans, the Next Big Threat to the U.S. Economy? , in which they reported that in the 3rd Quarter of 2013 “student loans outstanding more than 90 days shot up 11.8 percent” (3). Further the New York, Kansas City, St. Louis and San Francisco Federal Reserve Banks (FRB) have been monitoring this situation as well (4).

Although recently the Board of Governors of the Federal Reserve System noted in a Feb. 19, 2014 posting of the FEDS Notes that there was a recent “deceleration in student loan debt” mostly attributed to “a flattening out in the volume of student loan originations and college enrollment, along with increasing repayment rates on existing loans”, but they did note “we also anticipate sizable originations of student loans in coming years, reflecting persistently elevated levels of college enrollment and further rises in the costs of higher education.”(5)

Even so since the Bank of Ed is basically running a sub-prime market which is in reality dependent upon wages to pay them back (just like the mortgage sub-prime market), if there is a collapse in college level work wages then there is a greater risk of default. This is the way that college loans can become “underwater” through the inability to obtain work paying enough wages to support the loan. This issue is basically a structural problem with labor market and job creation versus any cyclical nature that might be occurring.

The only way to prevent this collapse is to socially build into the system some form of guaranteed wages. Currently the only guaranteed wage is minimum wage, so obviously this needs to be raised to higher levels to support the current debt load, or at least re-created so as to guarantee wage amounts for college degreed individuals.

The only other idea is to allow re-financing of the loans to longer terms and thus lowering the impacts of the loans and ensure a lower default risk. This is what some U.S. Senators want to do currently base on a Yahoo Finance news report where they want to allow student loans to be refinanced to 3.86% (6).

In the end I don’t think the college debt load will pop like the housing deals, but I do think the amount of debt can cause problems for the Federal deficit should the conditions which are supporting the loaning suddenly change which in turn could cause greater national debt to occur causing less government spending, higher taxes, the potential raising of the minimum wage, and/or the encouragement of greater student debt for college with refinance options to deal with the situation.

Citations

(1) Wenisch, M. (2012). The Student Loan Crisis and the Future of Higher Education. Catholic Social Science Review, 17345-350.

(2) Ross, A. (2013). Mortgaging the Future: Student Debt in the Age of Austerity. New Labor Forum (Sage Publications Inc.), 22(1), 23-28. doi:10.1177/1095796012471638

(3) Gage, C. S. & Lorin, J. (2014) Student Loans, the Next Big Threat to the U.S. Economy? BloombergBusinessweek, Economy online section. Retrieved on 5/12/2014 from http://www.businessweek.com/articles/2014-01-16/student-loans-the-next-big-threat-to-the-u-dot-s-dot-economy .

(4) Choi, Laura (2011). Student Debt and Default in the 12th District. Federal Reserve Bank of San Francisco, Community Development Research Brief. Retrieved on 5/12/14 from http://www.frbsf.org/community-development/files/student-debt-default-bay-area.pdf .

(4) Dai, Emily (2013). Student Loan Delinquencies Surge. Federal Reserve Bank of St. Louis, Inside the Vault, Spring 2013. Retrieved on 5/12/2014 from https://www.stlouisfed.org/publications/itv/articles/?id=2348 .

(4) Edmiston, K. D., Brooks, L., and Shelpelwich, S. (2012). Student Loans: Overview and Issues (Update). Revised 2013. Federal Reserve Bank of Kansas City, Research Working Papers. Retrieved on 5/12/14 from https://www.kansascityfed.org/publicat/reswkpap/pdf/rwp%2012-05.pdf .

(4) Federal Reserve Bank of New York (2013). Student Debt by Age Group. Retrieved on 5/12/14 from http://www.newyorkfed.org/studentloandebt/ .

(5) Hannon, S. and Mezza, A. (2014). A Few Thoughts on Recent Deceleration of Student Loan Debt. Board of Governors of the Federal Reserve System, FEDS Notes. Retrieved on 5/12/14 from http://www.federalreserve.gov/econresdata/notes/feds-notes/2014/a-few-thoughts-on-the-recent-deceleration-of-student-loan-debt-20140219.html .

(6) DiGangi, C. (2014). The New Proposal to Cut Student Loan Payments. Yahoo Finance: credit.com. Retrieved on 5/12/14 from http://finance.yahoo.com/news/proposal-cut-student-loan-payments-123055504.html .

Monday, May 12, 2014

Is College Debt bad for the Economy?


Well according to the New York Federal Reserve Bank student loan debt amounted to a mere $966 Billion by the end of the fourth quarter of 2012 (1). This would represent about 6.22% of the real GDP for the 4th Quarter of 2012 in comparison to the 67.23% of personal consumption and 18.91% of government consumption and investment (2).

Further the St. Louis Federal Reserve Bank did comment that student loans do appear to be impacting the economy in the short term, but refused to comment on the long term stating However, this topic is complex and more research is needed before suggesting policy prescriptions. (3)

Logically it would seem that having student debt would lower the amount of available income during the time of the loan thus decreasing abilities to both purchase items and save. But this all depends upon the ratio of the income to debt being paid. The worse this ratio is the worse the problem will be for the economy.

If anything student loan debt simply slows down the economy by sucking away potential consumption spending or savings.

The same could be said of housing to a lesser extent but only for existing housing vs. new housing. Economically the constant reselling of existing housing and the associated loans do nothing more than eat up potential income for a time and thus personal consumption and savings.

Both housing and student loans could be seen as excellent tools for dealing with inflation since if there is greater interest charged this could dampen any potential inflation caused by larger amounts of currency present. All one needs to do is simply make occasional adjustments to these key rates and viola you can make macro-adjustments as needed to the currency supply.

So in the end student loans are not really that bad for the economy since they now provide the Federal Government an excellent policy tool to deal with the economy (especially since the Bank of Ed opened its doors back in 2010), morally though I think one can make a strong argument that this is not a good idea linking higher education to such a debt mechanism.

Unlike a house, higher education debt is permanent in nature (you can only get out of it through death) and does not have a product that can be resold to at least recover from some of the debt (housing loans get you a house—higher education gets you a piece of paper with your name on it saying you completed a bunch of courses).

If given a choice between housing debt and college debt, I would take the housing debt because it offers better terms in general despite the potential economic bubble problems of the late 1990s.

Citations

(1) Federal Reserve Bank of New York (2013). Student Debt by Age Group. Retrieved on 5/12/14 from http://www.newyorkfed.org/studentloandebt/ .

(2) Federal Reserve Bank of St. Louis (2014). Economic Research. Data. Retrieved on 5/12/14 from http://research.stlouisfed.org/fred2/ .

(3) Elliott, William and Nam, Ilsung (2013). Is Student Debt Jeopardizing the Short-Term Financial Health of U.S. Households? Federal Reserve Bank of St. Louis Review. Sept/October 2013, Vol. 95, No. 5, pp 405-424. Retrieved on 5/12/14 from http://research.stlouisfed.org/publications/review/article/9963 .