Showing posts with label College Loans. Show all posts

Sunday, January 31, 2016

Debt to Income Ratios

As we all know lenders love to see low debt to income ratios. It helps them to determine the likelihood that the debt will be paid off.

In a recent Bloomberg article by Sarah Grant posted on Yahoo Finance certain college majors have lower income to debt ratios for undergrad degrees (please note that the group making the calculations did not factor in certain cost of living realities)(1).

Sounds great assuming that one is able to get into those programs, but that aside below is a chart from the article showing the various majors and DTIs.
From (1) The College Majors That Won’t Leave You Drowning in Debt. Bloomberg.

Obviously medicine tops the list as the lowest with what looks like less than 15%, whereas those going into Psychology have the worst at nearly 40% with Education a close second (1).

Here is the rub will all this talk about DTI—Bankers giving out housing loans use the same criteria to determine if an individual(s) can repay a housing loan. Typically they are looking for rates less than 36% (2).

So here you are just graduated with the Bank of ED loans, and let us say you marry that sweet heart you met in College (who also has Bank of ED loans). Now combined your DTI is somewhere around 30% let us say with both Bank of ED loans. So now you plan to leave the rat-hole of an apartment to get a used condo. This would mean you have combined DTI difference of about 6% to get something. Okay that is not enough to get anything really except maybe a cardboard box in an alley (unless your incomes are like that of Donald Trump and then that 6% is something significant).

And people wonder why the Millennials are not buying houses as fast as they should be… maybe the problem is the DTI is too high as soon as they walk out of college? Of course in order to lower this reality a few things will need to occur- 1. Those with College Education Loans need to automatically earn the highest wages possible (as if they had been working at a place for the last 30 years), 2. College Debt needs to be forgiven in masse, and/or 3. Prices of Houses need to drop significantly more.

Okay I think #1 is nearly impossible without some major shift in either the minimum wage to be based on educational attainment or social understanding of what college education is worth.

#2 is possible legislatively for Bank of ED loans under certain leadership assuming said leadership is willing to take the budget hit for writing off that much owed debt. Of course it could cause greater potential for credit default by the U.S. Treasury lowering the overall credit rating of T Notes to possible near junk without some serious raising of tax revenues or serious cut backs on spending.

 #3 could happen as the Baby Boomer age and are moved into some form of assisted living creating a major oversupply of available housing. This assumes that many are not taking out Reverse Mortgages which require them to live in place until they die. It also means that Millennials will have to settle for some seriously used homes from their parents which may require them to borrow even more so to just fix up the place.

At any rate, college debt clearly has skewed the economy of things in the U.S. probably for a long time.

Citations
(1) Grant, Sarah (Jan. 27, 2016). The College Majors That Won’t Leave You Drowning in Debt. Bloomberg. Retrieved From http://finance.yahoo.com/news/college-majors-wont-leave-drowning-181421870.html?soc_src=copy

(2) Bankrate (2016). Debt-to-income ratio calculator. Retrieved from http://www.bankrate.com/calculators/mortgages/ratio-debt-calculator.aspx

Thursday, December 24, 2015

Over Price Education, Getting a Job and Wages

On December 21st, Yahoo Finance had an article from Business Insider by Abby Jackson where a 35-year-old was suing his law school for his inability to get a job (1). The legal notion is that the school falsely advertised the resultants of what a college education will provide in income. In short its advertising created the illusion that he would get a great job earning a bunch of money upon graduation. Okay the article goes on to say he couldn’t pass the bar exam. A legal degree without passing the bar is sort of useless which makes one really question not the degree but the process of getting into the law field overall. Sort of begs the question, why even have a degree when the key thing is just passing the bar exam?

Meanwhile, back in 2011 a paper was published by Fastweb.com and FinAid.org that talked about the need for greater consumer protections where Private Education Loans are concerned through the new powers granted to the Consumer Financial Protection Bureau under Dodd-Frank (2). The paper suggests a series of to do lists most of which deal with providing loan education to students and families, but also the notion of restoring bankruptcy protections for borrowers of private loans (a really good idea and something that would probably help our law student) (2).

Okay the ideas in the 2011 paper are great, but this doesn’t help those who have went to the Bank of Ed (i.e. education loans provided by the Federal Government). These loans are basically what the Street would call junk bonds or penny stocks. They have no collateral under writing them and there is nothing ensuring that they can be paid except the premise that people with college education get more money.

While I do not disagree with the statistical fact that higher education has historically provided greater income then lower amounts of education these facts are based on observations mostly of the 20th Century where the bulk of our populace shifted from lower amounts of education to higher amounts as society and technology shifted to the modern era. In my opinion most of what accounts for the higher incomes is the social wage construct that the work associated with higher education should earn more.

When we started the 20th Century society we pretty much had a three tiered system of wages. The base wage which pretty much everyone got, the middle wage for managers and the like, and the top wage which was given to owners of businesses and socially elite. But once the minimum wage was legally created this created a new fourth and bottom tier. Since that point educational attainment has been imprinted greater on to these four tiers. The minimum wage tier is for the non-educated which has shifted to include now high school diploma holding individuals, the next tier is for bachelor degree holding people, the next tier is for masters and doctoral degree individuals, the highest tier is reserved pretty much for the socially elite or 1% as they have come to be known.

With our law student, he complains about being in the minimum wage tier and inability to support his college loans, which is a big duh since in the social construct of wage distribution he should be at least in the next tier up but he isn’t. Here we have the inherent problem of socially constructed wage distributions -- they are not guaranteed except for the lowest tier currently. There is nothing in the law to automatically provide for support of college loans based on educational attainment.

Currently there is a great focus and talk about raising the minimum wage, and no doubt some of it would be coming from those 20 and 30 somethings saddled with college debt and no way out. A lot of the talk these days is focused on how raising the minimum wage will kill jobs (3). While I do not doubt that on a micro-economic level raising the minimum wage will impact certain localities and particular businesses, overall all in the macro-economic sense this impact doesn’t seem to be as big. Below is chart I created from ALFRED showing two major industries typically where minimum wage work is found and the change in the Federal Minimum wage over the last 75 years or so (4-6).


What you will really note is the fact most declines in employment with these two industries appears to be more related to the up and downs of business cycles than increases in the minimum wage. If the Federal Minimum Wage was linked to a COLA adjustment then we might see a greater macro influence on these employment numbers, but it seems to me the raise in the minimum wage is more impacted by political pressure during tougher times economically. In fact, during periods of business expansion one tends to see the cost of goods and services rise since usually during these expansion periods inflation can occur eroding the value of income. This could explain some of the political pressure during certain periods of time. There also appears to be politically the idea of raising the minimum wage during declining business cycles will somehow improve the economy overall (note the changes during recession periods marked in grey). Although I think this is more politicians catering to a voting public than actual economic policy.

My point is we may be forced to raise the minimum wage politically to ensure the Federal Government is not saddled with a large amount of unpaid student debt. The minimum wage is the only tool the Federal Government has to ensure there is enough income to pay these loans off when the labor pool for higher education work is over crowded with too much supply. This is what one gets for years of promoting higher education will lead to economic prosperity, not unlike that early 20th Century idea that owning a home will do the same thing and look where that got us in 2008.

Citations

(1) Jackson, Abby. (Dec. 21, 2015). A guy with $170,000 in student loans who can’t find a job in the legal profession is suing his law school and working full time for Uber. By Business Insider published on YahooFinance. Retrieved from http://finance.yahoo.com/news/guy-170-000-law-school-204811509.html?soc_src=copy

(2) Kantrowitz, Mark. (2011). Education Lending Suggestions for the Consumer Financial Protection Bureau (CFPB). Published by Fastweb.com and FinAid.Org.

(3) Soergel, Andrew. (Dec. 22, 2015). Fight for $15 Not All It’s Cracked Up to Be- Research suggests a higher minimum wage could increase costs for consumers and weigh on job growth. U.S. News & World Report. Retrieved from http://www.usnews.com/news/articles/2015-12-22/minimum-wage-increase-comes-with-cadre-of-potential-complications

(4) US. Bureau of Labor Statistics, All Employees: Service-Providing Industries [SRVPRD], retrieved from FRED, Federal Reserve Bank of St. Louis https://alfred.stlouisfed.org/fred2/series/SRVPRD/, December 24, 2015.


(5) US. Bureau of Labor Statistics, All Employees: Retail Trade [USTRADE], retrieved from FRED, Federal Reserve Bank of St. Louis https://alfred.stlouisfed.org/fred2/series/USTRADE/, December 24, 2015.

(6) US. Department of Labor, Federal Minimum Hourly Wage for Nonfarm Workers for the United States [FEDMINNFRWG], retrieved from FRED, Federal Reserve Bank of St. Louis https://alfred.stlouisfed.org/fred2/series/FEDMINNFRWG/, December 24, 2015.

Tuesday, December 22, 2015

Ashley Fleming’s Story

Okay below is a link to video of 24-year-old (Ashley Fleming) up to her eyeballs in debt (1). It is a pretty sad story if you think about it, and no doubt also one that is more than likely common with those of her generation.

https://screen.yahoo.com/100k-debt-1-semester-left-193814146.html

What is sadder I think is the in the December 18th Yahoo article by Vanessa Sanchez, “financial aid expert Mark Kantrowitz” said “if your total student debt is going to be more than your income once you graduate, you should probably look into another school.” (1).

How do you even know what your income will be once you graduate? Okay you might have a rough idea, but it is not like the college is going to guarantee the degree will automatically yield enough to pay for the loan. Let us take Ashley’s situation…she is attending a college with a $43,000 a year tuition.

Okay let us assume for a moment the following-

1. Ashley doesn’t’ start paying the loan until she graduates.

2. She actually just went four years straight (unlike the actual story).

3. The current loan rate is 4.29%.

4. The term of the loan is 10 years.

5. The present value of all debt owed is $172,000 (4 years at $43,000 a year).

This would mean for each of the ten years her annual payment is $21,513.29. Let us assume for a moment that the debt to income ratio should be similar to that of a mortgage which most say is around 28% to 36% (2).

This would mean right of the gate Ashley would need to be earning an annual income of $59.7K to $76.8K.

Could be possible but it is not guaranteed in our U.S. society. In fact, the only legally guaranteed wage is that of the minimum wage.

All the talk we hear of college graduates making $X more dollars than non-college graduates is primarily the resultant of a social construct from the 20th Century. During the 20th Century our U.S. population shifted in educational attainment from basically grade school to high school to then college. In doing so the accepted social construct of higher wages for greater educational attainment pretty much stayed the same (i.e. grade school got you X, high school got you X+1, college got you X+2). But now with pretty much everyone going to college we have leveled the workforce to a common reality which in time will cause everyone’s wages to be basically the same (standard supply/demand economics) if not fall to the lowest common denominator (i.e. minimum wage).

The solution proposed to this economic reality will no doubt be just adding more education to the equation. If people, simply keep getting higher and higher degrees (i.e. more education) we can keep the income growth curve from collapsing. Although how higher can one go than Post-Doc degrees?
And exactly how much debt will all this cost our economy? And exactly how much sales would be required for a business to support all these highly educated Americans? Wow I hope the Chinese are willing to pay a lot for our highly educated workforce.

Now don’t get me wrong. Education is a good thing, but when tied to certain economic realities such as income and debt there becomes a distortion where the haves and haves not become increasingly obvious (as with Ashley’s story).


Citations

(1) Sanchez, Vanessa. Dec. 18, 2015. $100K in debt, 1 semester left and no cosigner in sight. Yahoo Finance. Retrieved from http://finance.yahoo.com/news/-100k-in-debt--1-semester-left-and-no-cosigner-in-sight-190859531.html?soc_src=copy

(2) da Costa, Polyana. (2011) Why debt to income matters in mortgages. Bankrate. Retrieved from http://www.bankrate.com/finance/mortgages/why-debt-to-income-matters-in-mortgages-1.aspx

Tuesday, June 10, 2014

Is the recent Presidential Memo a good idea?

President Obama has issued as of 6/9/14 a memo directing the Department of Education to develop regulations concerning to limit the student repayments of loans to a maximum of 10% of the borrower’s income (1).

While on the surface this seems a like a good idea, but right off the bat it seems to me that this is form flat 10% income tax to those who borrower for education from the Bank of Ed. Let us see how the math stacks up.

Using some calculations from a previous postingWill you make more money with a college degree?” let us assume the loan is capped at 10% of gross income, and is completely forgiven in 20 years (1, 2). I will use the same income and expenses used from my previous post (2).


 Total Net Income (20 years, 2013 dollars)
Less
than
high
school
graduate
High
school
graduate
High
school
graduate
with
some
college
Associate's
degree
Bachelor's
degree
10% income College Loan
($53,878.91)
$2,931.01
($9,771.92)
$107,709.59
$294,173.35
w/o College Loan
$2,931.01
$114,601.57
$127,057.65
$285,922.26
$537,625.79
Total Loan Amount Paid over 20 Years
$71,385.51
$111,670.56
$136,829.56
$178,212.68
$243,452.44

Still clearly you will come ahead not taking the loan, but what is interesting is what happens if you end up with a job that makes the median income typically associated with lower educational attainment. 

So this would be you go to college, take out one of these 10% of income loans, and then end up working for a job that requires less than high school education because this all you could get and you get stuck in it for 20 years. Well then you will have really cost yourself more money than had you landed that median Bachelor’s degree job. Bottom line is it appears this loan process will punish those who are unable to obtain that median college income job.

Clearly then it is better to go to a more prestigious university or college, where the debt load will be higher due to more expensive tuition, and hopefully provide you with better opportunity to land that well-paying median job through the extensive alumni network.

Of course what this means politically is that the federal government must now ensure some macroeconomic mechanism that will encourage the growth of these well paying higher educational jobs to keep up with college graduation rates. After all it has a vested interest to do so as the more people who don’t end up with these higher paying jobs will in the increase the costs of national debt since educational loans are nothing but a budget offset.

Hmmm… the idea of a minimum wage based on educational attainment is sounding better and better.

Citations

(1) Office of the President, White House (2014). FACTSHEET: Making Student Loans More Affordable. Retrieved on 6-10-14 from http://www.whitehouse.gov/the-press-office/2014/06/09/factsheet-making-student-loans-more-affordable/

(1) Office of the Press Secretary, White House (2014). Presidential Memorandum -- Federal Student Loan Repayments. Retrieved on 6-10-14 from http://www.whitehouse.gov/the-press-office/2014/06/09/presidential-memorandum-federal-student-loan-repayments

(2) Bureau of Labor Statistics (2014). Consumer Price Index- All Urban Consumers. Series ID: CUSR0000SA0. Databases, Tables & Calculators by Subject. Data. Retrieved on 5-10-14 from http://www.bls.gov/data/  

(2) Bureau of Labor Statistics (2014). (unadj)- Usual weekly earnings (first decile), Employed full time, Wage and salary workers, High school graduates, no college, 25 years and over. Series ID: LEU0252917100. Databases, Tables & Calculators by Subject. Data. Retrieved on 5-10-14 from http://www.bls.gov/data/  

(2) Bureau of Labor Statistics (2014). (unadj)- Usual weekly earnings (first quartile), Employed full time, Wage and salary workers, High school graduates, no college, 25 years and over. Series ID: LEU0252917200. Databases, Tables & Calculators by Subject. Data. Retrieved on 5-10-14 from http://www.bls.gov/data/

(2) Bureau of Labor Statistics (2014). (unadj)- Median usual weekly earnings (second quartile), Employed full time, Wage and salary workers, High school graduates, no college, 25 years and over. Series ID: LEU0252917300. Databases, Tables & Calculators by Subject. Data. Retrieved on 5-10-14 from http://www.bls.gov/data/  

(2) Bureau of Labor Statistics (2014). (unadj)- Median usual weekly earnings (second quartile), Employed full time, Wage and salary workers, High school graduates, no college, 25 years and over. Series ID: LEU0252917300. Databases, Tables & Calculators by Subject. Data. Retrieved on 5-10-14 from http://www.bls.gov/data/

(2) Bureau of Labor Statistics (2014). (unadj)- Usual weekly earnings (third quartile), Employed full time, Wage and salary workers, High school graduates, no college, 25 years and over. Series ID: LEU0252917400. Databases, Tables & Calculators by Subject. Data. Retrieved on 5-10-14 from http://www.bls.gov/data/

(2) Bureau of Labor Statistics (2014). (unadj)- Usual weekly earnings (ninth decile), Employed full time, Wage and salary workers, High school graduates, no college, 25 years and over. Series ID: LEU0252917500. Databases, Tables & Calculators by Subject. Data. Retrieved on 5-10-14 from http://www.bls.gov/data/  

(2) Bureau of Labor Statistics (2014). (unadj)- Usual weekly earnings (first decile), Employed full time, Wage and salary workers, Bachelor's degree only, 25 years and over. Series ID: LEU0252918900. Databases, Tables & Calculators by Subject. Data. Retrieved on 5-10-14 from http://www.bls.gov/data/  

(2) Bureau of Labor Statistics (2014). (unadj)- Usual weekly earnings (first quartile), Employed full time, Wage and salary workers, Bachelor's degree only, 25 years and over Series ID: LEU0252919000. Databases, Tables & Calculators by Subject. Data. Retrieved on 5-10-14 from http://www.bls.gov/data/  

(2) Bureau of Labor Statistics (2014). ((unadj)- Median usual weekly earnings (second quartile), Employed full time, Wage and salary workers, Bachelor's degree only, 25 years and over. Series ID: LEU0252919000. Databases, Tables & Calculators by Subject. Data. Retrieved on 5-10-14 from http://www.bls.gov/data/  

(2) Bureau of Labor Statistics (2014). (unadj)- Usual weekly earnings (first quartile), Employed full time, Wage and salary workers, Bachelor's degree only, 25 years and over Series ID: LEU0252919100. Databases, Tables & Calculators by Subject. Data. Retrieved on 5-10-14 from http://www.bls.gov/data/  

(2) Bureau of Labor Statistics (2014). (unadj)- Usual weekly earnings (third quartile), Employed full time, Wage and salary workers, Bachelor's degree only, 25 years and over. Series ID: LEU0252919200. Databases, Tables & Calculators by Subject. Data. Retrieved on 5-10-14 from http://www.bls.gov/data/  

(2) Bureau of Labor Statistics (2014). (unadj)- Usual weekly earnings (ninth decile), Employed full time, Wage and salary workers, Bachelor's degree only, 25 years and over. Series ID: LEU0252919300. Databases, Tables & Calculators by Subject. Data. Retrieved on 5-10-14 from http://www.bls.gov/data/  

(2) Bureau of Labor Statistics (2013). Table 2010- Highest education level of any member: Annual expenditure means, shares, standard errors, and coefficient of variation, Consumer Expenditure Survey, 2012. Consumer Expenditure Survey. Combined Expenditure, Share, and Standard Error Tables. Retrieved on 5-10-14 from http://www.bls.gov/cex/csxcombined.htm .


Sunday, May 25, 2014

Is a College Degree worth all the trouble of a loan?

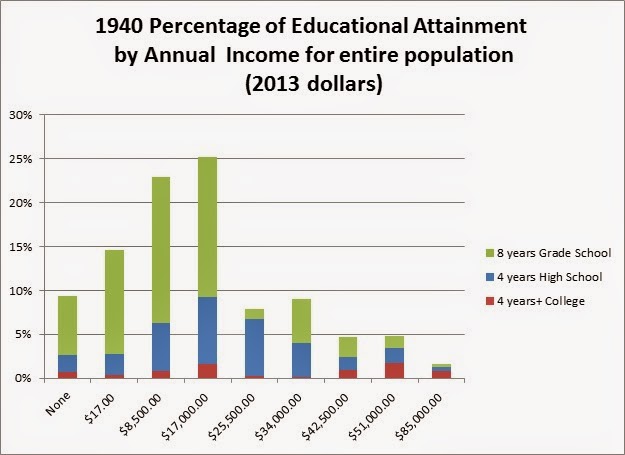
The problem with this question is one of definitions and how we measure the value of things. A college degree is inherently something good in nature as such it should hold some significant value to both the individual holding the degree and the society at large. In theory, the knowledge gained from a college degree should allow the individual to obtain work associated with said knowledge, but in our capitalistic market system this is not guaranteed. Further, it is a mere social convention of recent times that those with college education should be paid more than those with say a high school education. There are no laws compelling businesses to pay according to this norm, except the minimum wage which is currently set at $7.25 an hour as the federal minimum (some states can have higher). To help illustrate this point I have included two graphs from the 1940 on educational attainment vs. wages paid.

As the Chart 1 shows when the 1940 census data is charted as the percentage of the total population per income bracket by educational attainment it becomes very clear that having a college degree should earn you more money. Those with such degrees clearly occupy a much greater percentage of the highest income bracket at that time, and thus supporting the current thesis that college education gets you more income.

Chart 1- Source: U.S. Census (1) & Bureau of Labor Statistics for dollar conversion (2).

But when you chart this same data (see Chart 2) so as to see the distribution of income with in the society as whole by educational attainment you come up with a different picture. You quickly realize that majority of people in 1940 were making $8,500 to $17,000 2013 Dollars per year. In fact a careful examination of the data reveals that those with college education seem to be split into two groups. One group making the normal wage that most of the populace is making and then a group making a lot more.


Chart 2- Source: U.S. Census (1) & Bureau of Labor Statistics for dollar conversion (2).

The problem is trying to do this kind of analysis with current data is not truly possible because the information is typically arranged in a statistical bell-curve pattern using median values. As such to tease out the data represented in Chart 2 is much more difficult, if not nearly impossible.

What can be done is comparing ranges and medians of the groups (see Chart 3). As such can see some overlay of income brackets, but since the median value represents the 50% mark it is hard to tell if there are truly more people in the higher end or lower end since it is nice smoothed bell-curve. What can be told is there does appear to be some overlap between the two educational degrees suggesting that it is possible that for someone with a bachelor degree to earn just as much as the median income of a high school degree. I suspect if the true population values were known per income groupings that we would no doubt see more of a curve similar to that of 1940.


Chart 3- Source: Bureau of Labor Statistics (2 & 3).

If anything what this information is more suggestive is that there are two major groups of people living and working in the U.S. currently. One group which is an overwhelming majority of the people earning pretty much the same wage regardless of educational attainment, and another group earning vastly much more and having higher education overall in comparison to the rest of the populace.

So does it mean is a college loan is worth all the trouble? I have to answer that I don’t think so, not really because of the possibility of not earning the median or higher wage amounts, but chiefly because of reasons mentioned in this and previous post concerning this type of loan. This is a loan that you can only get out of through death should something go wrong with the ability to pay. You cannot even try to “re-sell” the object you bought with the loan because it is just for you alone. That kind of loan is not worth any hope of better life, because you in the end become a slave to such a debt and such a life will be fraught with potential hardship.

It is far better to try one’s best to pay as you go, using any free money one can get (i.e. grants, grandparent’s paying for tuition, etc.). Sure this method may take you longer, but in the end you will have more freedom than one chained to debt.

Citations

(1) U.S. Census (1940). Table 2 - Wage or Salary Income in 1939, For Native White Males 25 To 64 Years Old Without Other Income, By Years of School Completed and Age, For The United States, Urban and Rural-Nonfarm: 1940. CPS Data on Educational Attainment: Educational Attainment. Data. Retrieved on 5-10-14 from http://www.census.gov/hhes/socdemo/education/data/cps/1946/p46-5/tables.html

(2) Bureau of Labor Statistics (2014). Consumer Price Index- All Urban Consumers. Series ID: CUSR0000SA0. Databases, Tables & Calculators by Subject. Data. Retrieved on 5-10-14 from http://www.bls.gov/data/  

(3) Bureau of Labor Statistics (2014). (unadj)- Usual weekly earnings (first decile), Employed full time, Wage and salary workers, High school graduates, no college, 25 years and over. Series ID: LEU0252917100. Databases, Tables & Calculators by Subject. Data. Retrieved on 5-10-14 from http://www.bls.gov/data/ 

(3) Bureau of Labor Statistics (2014). (unadj)- Usual weekly earnings (first quartile), Employed full time, Wage and salary workers, High school graduates, no college, 25 years and over. Series ID: LEU0252917200. Databases, Tables & Calculators by Subject. Data. Retrieved on 5-10-14 from http://www.bls.gov/data/ 

(3) Bureau of Labor Statistics (2014). (unadj)- Median usual weekly earnings (second quartile), Employed full time, Wage and salary workers, High school graduates, no college, 25 years and over. Series ID: LEU0252917300. Databases, Tables & Calculators by Subject. Data. Retrieved on 5-10-14 from http://www.bls.gov/data/ 

(3) Bureau of Labor Statistics (2014). (unadj)- Median usual weekly earnings (second quartile), Employed full time, Wage and salary workers, High school graduates, no college, 25 years and over. Series ID: LEU0252917300. Databases, Tables & Calculators by Subject. Data. Retrieved on 5-10-14 from http://www.bls.gov/data/ 

(3) Bureau of Labor Statistics (2014). (unadj)- Usual weekly earnings (third quartile), Employed full time, Wage and salary workers, High school graduates, no college, 25 years and over. Series ID: LEU0252917400. Databases, Tables & Calculators by Subject. Data. Retrieved on 5-10-14 from http://www.bls.gov/data/ 

(3) Bureau of Labor Statistics (2014). (unadj)- Usual weekly earnings (ninth decile), Employed full time, Wage and salary workers, High school graduates, no college, 25 years and over. Series ID: LEU0252917500. Databases, Tables & Calculators by Subject. Data. Retrieved on 5-10-14 from http://www.bls.gov/data/ 

(3) Bureau of Labor Statistics (2014). (unadj)- Usual weekly earnings (first decile), Employed full time, Wage and salary workers, Bachelor's degree only, 25 years and over. Series ID: LEU0252918900. Databases, Tables & Calculators by Subject. Data. Retrieved on 5-10-14 from http://www.bls.gov/data/ 

(3) Bureau of Labor Statistics (2014). (unadj)- Usual weekly earnings (first quartile), Employed full time, Wage and salary workers, Bachelor's degree only, 25 years and over Series ID: LEU0252919000. Databases, Tables & Calculators by Subject. Data. Retrieved on 5-10-14 from http://www.bls.gov/data/ 

(3) Bureau of Labor Statistics (2014). ((unadj)- Median usual weekly earnings (second quartile), Employed full time, Wage and salary workers, Bachelor's degree only, 25 years and over. Series ID: LEU0252919000. Databases, Tables & Calculators by Subject. Data. Retrieved on 5-10-14 from http://www.bls.gov/data/ 

(3) Bureau of Labor Statistics (2014). (unadj)- Usual weekly earnings (first quartile), Employed full time, Wage and salary workers, Bachelor's degree only, 25 years and over Series ID: LEU0252919100. Databases, Tables & Calculators by Subject. Data. Retrieved on 5-10-14 from http://www.bls.gov/data/ 

(3) Bureau of Labor Statistics (2014). (unadj)- Usual weekly earnings (third quartile), Employed full time, Wage and salary workers, Bachelor's degree only, 25 years and over. Series ID: LEU0252919200. Databases, Tables & Calculators by Subject. Data. Retrieved on 5-10-14 from http://www.bls.gov/data/ 

(3) Bureau of Labor Statistics (2014). (unadj)- Usual weekly earnings (ninth decile), Employed full time, Wage and salary workers, Bachelor's degree only, 25 years and over. Series ID: LEU0252919300. Databases, Tables & Calculators by Subject. Data. Retrieved on 5-10-14 from http://www.bls.gov/data/